AI applications are incredibly diverse, and a single article can’t cover them all. So, can AI be applied to trading? The short answer is yes. For stock and crypto traders, technical analysis is a valuable reference before making buy or sell decisions. Not everyone has the knowledge to perform technical analysis, but now AI can do this for us. So how can we use AI in trading? How can we leverage AI for technical analysis and trend forecasting? Join me as we explore this in today’s article.

Overview of Technical Analysis
What is Technical Analysis?
Technical analysis is a methodology that uses historical asset data—primarily price and trading volume—along with behavioral analysis theories and market psychology to predict the future direction of an asset.
Along with fundamental analysis (usually based on financial reports), technical analysis is one of the two most important and regular activities performed by professional stock and crypto investors and speculators.
Is Technical Analysis Accurate?
The honest answer is: not always. Market movements are consistently difficult to predict, so we should only consider technical analysis as one of many useful reference points for making trading decisions.
Theories and Indicators Used in Technical Analysis
Let me outline the main theories and indicators commonly used by technical analysts:
1. Dow Theory
Dow Theory is a set of 6 principles used to identify market trends. It’s considered the foundation and basis for the first system that developed many important indicators such as RSI, Elliot Waves, MA, and more.
Dow Theory is built on 6 basic principles:
Principle 1: The Market Reflects Everything All stock market information (from past to present) is reflected in stock prices and related indicators such as GDP, inflation, interest rates, investor sentiment, etc. (excluding unexpected factors like terrorism, natural disasters like earthquakes, tsunamis, etc.)
Principle 2: Three Market Trends According to Charles Dow, the market always has 3 main trends with 3 levels. Each trend has its own characteristics.
- Level 1: Primary Trend – This is the trend investors care about most and lasts the longest, typically 1 to 3 years, divided into uptrends and downtrends. It’s very difficult to predict the primary trend, and no individual or organization can manipulate it.
- Level 2: Secondary Trend – Usually lasting only 1 to 3 months. Secondary trends tend to move against the primary trend.
- Level 3: Minor Trend – Lasting no more than 3 weeks and tends to move against the secondary trend.
Level 2 and 3 trends are often not very clear and can be noisy. If investors focus too much on level 2 and 3 trends while paying little attention to level 1, they may miss major long-term investment opportunities.
Principle 3: Main Trends Have Three Phases The main trend of the stock market typically has 3 development phases.
For bullish trends, the 3 phases include:
- Accumulation Phase: During this phase, the market moves slowly with little change. This phase is typically at the end of a downtrend, when asset prices are relatively low. This phase is difficult to identify, making it hard for investors to recognize whether the downtrend has truly ended.
- Breakout Phase: The phase when stock prices begin to rise sharply, investors buy in and wait for the explosion opportunity.
- Excess Phase: The phase when the market has reached its peak increase and begins to weaken. Some investors start selling their stocks, and the market begins a downward trend.
The 3 phases of a bearish trend:
- Distribution Phase: The downward trend begins when investors continue to buy, believing prices will continue to rise but not realizing they’re buying at the peak.
- Despair Phase: The time when many negative news stories are released, causing investors to panic and seek to sell off.
- Capitulation Phase: The phase when the market looks bleak, and investors sell off, causing prices to plummet. At this point, the accumulation phase begins, and a new trend cycle repeats.
Principle 4: Trends Are Determined by Trading Volume According to Dow Theory, trading volume increases according to market trends. Based on trading volume, investors determine the strength of a trend—if the price increases, trading volume should increase accordingly, and vice versa.
However, in some cases, trading volume moves against the market trend. This indicates weakness in the trend, and the market may reverse direction soon.
Principle 5: Average Indices Must Confirm Each Other According to Dow Theory, market reversal is identified by two indices: the industrial index and the rail index. This means signals occurring on one index’s chart must correspond to signals on another index’s chart. These two indices are the industrial average index and the rail index.
Principle 6: Trends Continue Until Reversal Signals Appear Market trends will continue until reversal signals emerge. Investors need to be patient and observant to spot reversal signals and develop effective trading strategies based on the actual situation.
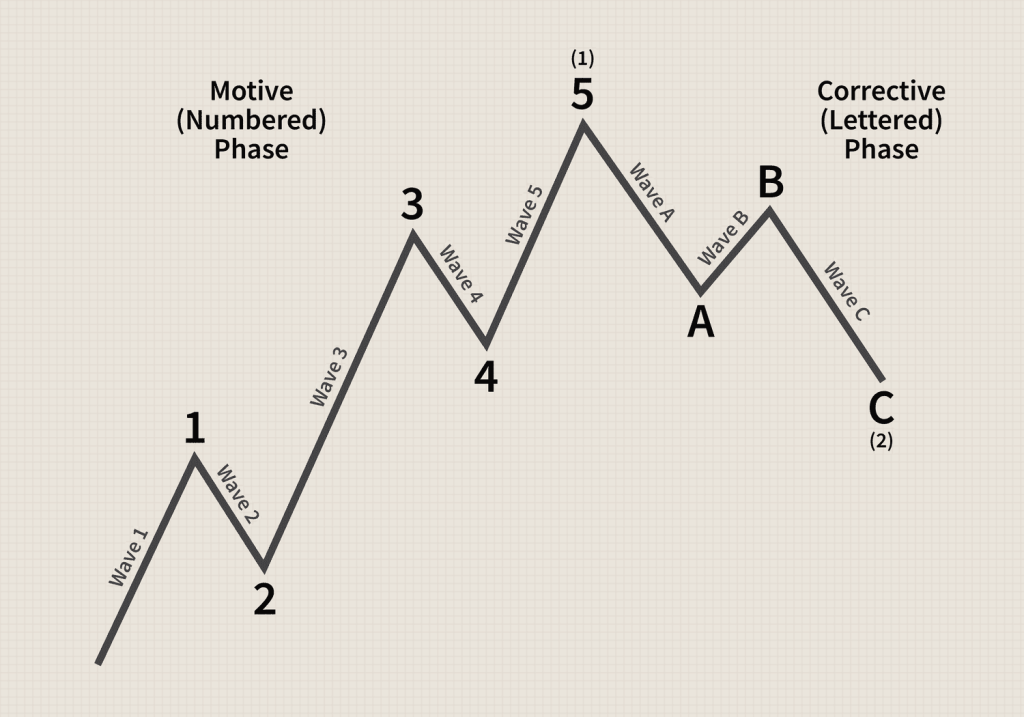
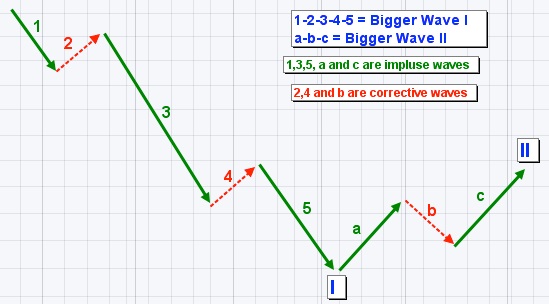
2. Elliott Wave Theory
Elliott Wave is a model for predicting asset price trends, according to which the price of an asset will include 5 main waves (up or down) followed by 3 corrective waves in the opposite direction (down or up).
3. Bollinger Bands
Bollinger bands are a combination of Moving Average (MA) lines and standard deviation. This indicator consists of a middle moving average line and upper and lower boundary lines.
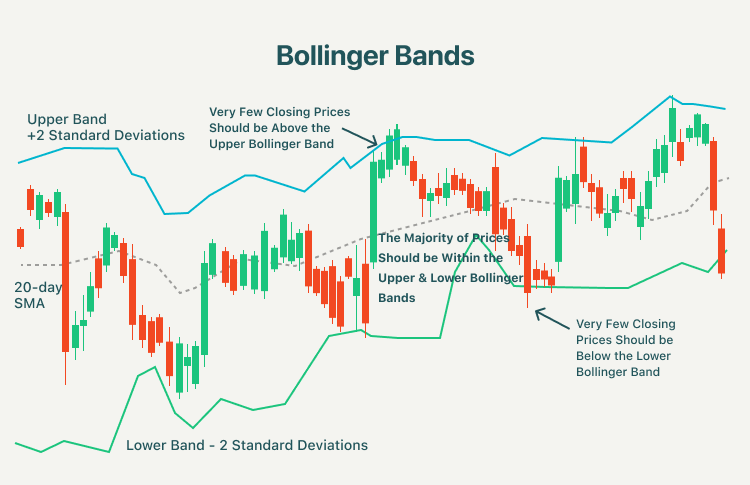
The distance between the MA line and its Bollinger bands is determined by price volatility. When stock prices fluctuate significantly, the Bollinger bands widen, and conversely, when stock prices fluctuate less, the Bollinger bands gradually narrow.
- When the price line moves on the upper band, it means the market may be overbought, and conversely, when the price line moves on the lower band, the market may be oversold.
- When Bollinger bands narrow, it predicts the market is in an accumulation phase, waiting for a breakout opportunity. When Bollinger bands widen, the market is in a phase of high volatility, with potentially more opportunities for long/short positions during this phase.
4. RSI (Relative Strength Indicator)
The RSI is an index comparing the ratio between the number of days with price increases and the number of days with price decreases, with data fluctuating between 0 and 100 (with an average of 50). The RSI uses a single parameter, a number measuring time to calculate volatility (typically 14 days).
The RSI has values from 0 to 100, with below 30 considered oversold (suggesting buying), and above 70 considered overbought (suggesting selling).
5. Moving Average (MA) Lines
The SMA (Simple Moving Average) line is calculated by the arithmetic mean of closing prices over a specific trading period.
The EMA (Exponential Moving Average) line is calculated using an exponential formula that emphasizes the most recent price movements. As a result, EMA is quite sensitive to short-term fluctuations, identifying abnormal signals faster than SMA, helping investors react more quickly to short-term price movements.
- MA lines for 5, 10, or 20 days are typically used for short-term forecasting
- MA lines for 50 or 100 days are typically used for medium-term forecasting
- MA lines for 150 or 200 days are typically used for long-term analysis
When the price line crosses above or below the corresponding MA lines, it’s considered a forecast of a trend reversal.
6. Fibonacci Retracement
Fibonacci is a formula for predicting resistance and support levels. Fibonacci typically uses ratios of 38.2%, 50%, 61.8%, 78.6%, and 100%, and can also use 127.2%, 161.8%, 261.8%, 423.6%.
Fibonacci calculation examples:
Example 1: Stock A rises from $60 to $100, then drops to $70 and is rising again. We can predict the levels (resistance) to which stock A may rise as follows:
- 38.2% level = 70 + (100-60) * 38.2% = 85.28
- 50% level = 70 + (100-60) * 50% = 90
- 61.8% level = 70 + (100-60) * 61.8% = 94.72 … When reaching these price levels, the stock is likely to reverse downward.
Example 2: Stock A rises from $60 to $100 and is currently in a downward correction. The price levels A may drop to according to Fibonacci are:
- 38.2% level = 100 – (100-60) * 38.2% = 84.72
- 50% level = 100 – (100-60) * 50% = 80
- 61.8% level = 100 – (100-60) * 61.8% = 75.28 When reaching these price levels, the stock is likely to reverse upward again.
Similarly, you can calculate the same way for downtrends.
7. Candlestick Reversal Patterns
Here are some key candlestick reversal patterns:
- Hammer and Hanging Man
- Engulfing patterns (Bullish and Bearish)
- Morning Star and Evening Star
- Doji
- Shooting Star
- Three White Soldiers and Three Black Crows
- Piercing Line and Dark Cloud Cover
- Harami (Bullish and Bearish)
- Tweezer Tops and Bottoms
How to Analyze and Forecast Trends Using AI
You can create a fully automated crypto/stock technical analysis using AI.

- Step 1: Go to minitoolai.com
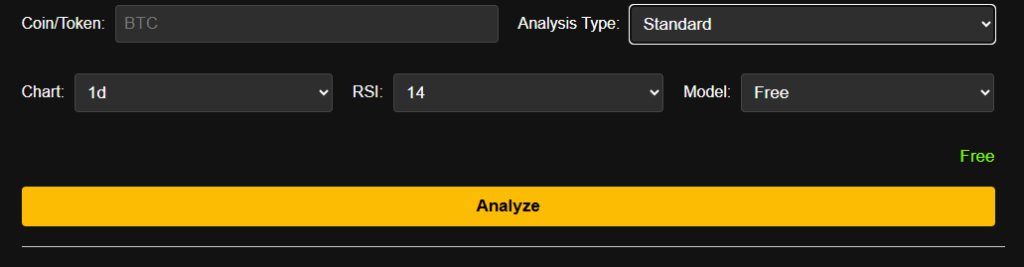
- Step 2: Select the Stock/Crypto TA generator tool
- Step 3: Enter the stock or crypto symbol
- Step 4: Customize
Analysis type: Short-term, long-term, or medium-term
Chart type: 15m, 1d, 1w, etc. Step 5:
Click the Analyze button
Wait a few seconds, and the AI will provide a comprehensive analysis and forecast trends for you.
Can I Do Technical Analysis Myself?
Yes, you need to understand technical analysis and use tools that support drawing indicators like Tradingview
You just need to enable the indicators and then read and analyze them yourself.
Conclusion
Above, I’ve introduced the basic knowledge of technical analysis and how to use AI to analyze stocks and cryptocurrencies. I hope it’s helpful—if you have any feedback, please leave a comment below!
")


